There are a lot of bullish indicators suggesting gold pricing will maintain its current levels over 2020. While to date, capital has only started to return to gold miners, it has yet to trickle down to the junior gold miners.
With increased cash flow from higher gold prices, and more and more production growth being done by the drill-bit, junior gold miners will start to see increased interest. This will lead to increased exploration and mine development, catalysts in the form of M&A, and generally lead to increased stock prices.
To help investors understand the landscape, we completed a breakdown of the top junior gold stocks in the industry. While the list is not comprehensive, it provides an initial screen of which juniors warrant further due-diligence.
If you’re interested in looking at intermediate gold miners or senior gold miners, make sure you check out our other feature reviews.
Taking Stock of the Junior Gold Miners
Among the juniors, we’ve looked at 9 miners that we believe deserve consideration as a top gold investment:
- Alacer Gold
- Dacian Gold
- Dundee Precious Metals
- Ramelius Resources
- Resolute Mining
- Roxgold Inc.
- Silver Lake
- Teranga Gold
- TMAC
We compared each of these companies by the following criteria:
- Implied Upside
- Price to Net Asset Value
- Price to Cash Flow
- Enterprise Value to EBITDA
- Annual Production
- All-in Sustaining Cost of Mining per oz
- Debt to Capital and Cash
- Political Risk
We’ve summarized the analysis in terms of attractiveness in the following scorecard. You can read our full breakdown below.

Compared to our previous look at Seniors and Intermediates, the field is much more challenging to decipher.
Group Analysis
The following series of charts illustrate how the key metrics of these junior gold miners stack up against their peers. This is followed by a high-level overview of each miner.
To set the stage we reviewed the implied upside from the current stock price based on consensus analyst target prices — this provides context around the potential upside relative to the senior gold peer group average.
Implied Upside to Consensus Target Price

Next, we looked at the price to net asset value to determine how the junior is trading relative to its total reserves and resources. This is a fundamental metric to determine what you’re buying over a longer time horizon.
Price to Net-Asset-Value

Turning to operations, we also looked at 2020 production forecasts of each junior gold miner and compared them to the previous year to gauge the direction they are headed.
2019 and 2020 Production Estimates

Looking at the more traditional metrics of price to cash flow (P/CF) and EV/EBITDA and dividend yield, these values provide an illustration of the juniors’ current operations.
As with any sector, cash is king, so buying cash flow at a discount is always preferred. Similarly, EV/EBITDA provides a solid lens from which to assess the profitability of a company’s operations relative to price — no one wants to pay a premium for unprofitable operations.
2020 Price to Cash Flow Estimates

2019 EV/EBITDA Estimates

Source: YCharts, Company Filings, Capital 10X Estimates
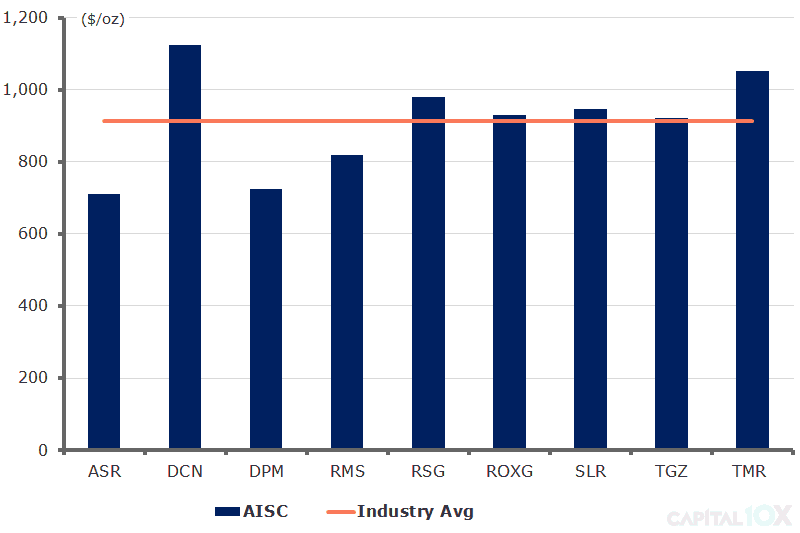
Finally, we reviewed key operational and balance sheet metrics to assess the junior miners’ operational leverage and health of their balance sheet. The lower the AISC, the more free cash flow a company can generate per ounce of gold. The ratio of debt to capital and cash balance gives investors a clear picture of a stock’s balance sheet health.
2020 AISC Estimates

Debt to Capital


